Product Cross-Sale
This is a Club Prophet Executive Report v4 – Power BI or PBI.
Note: Samples are using demo data and do not reflect real-world data.
Product Cross-Sale
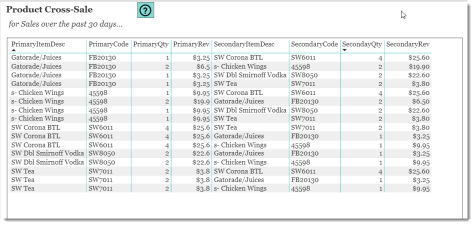
This report provides trend insights on what product sell with other products. To do so we look at all the sales within the past three days from the current date.
Fields on the report include:
-
Primary Item Description – the product description of the primary or 1st product.
-
Primary Item Code – the product code of the primary or 1st product.
-
Primary Qty – the number of units sold of the primary or 1st product.
-
Primary Revenue – the amount of revenue (extended price) of the primary or 1st product.
-
Secondary Item Description – the product description of the primary or 2nd product.
-
Secondary Item Code – the product code of the primary or 2nd product.
-
Secondary Qty – the number of units sold of the primary or 2nd product.
-
Secondary Revenue – the amount of revenue (extended price) of the primary or 2nd product.
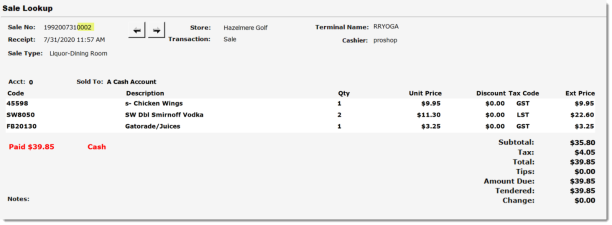
This report is quite clever but not very intuitive, so let’s walk thru a specific example with just the following two sales:
These sales have some items that are the same and some that are unique. So, the question may be: When selling an order of wings, what is the most popular product that is sold with those wings? In this case, the wings are the primary product and the other items sold with wings are the secondary product.
Note: Every product will be both a primary and secondary product as long as they are sold with something else in the past 30 days.
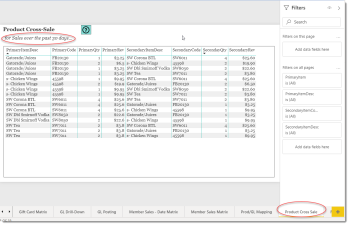
To really simplify this, you need to look at the PrimaryItemDesc = “s-Chicken Wings” using the filter circled on the right.
Now, if you go back and look at the two sales, you will note that there were two orders of chicken wings sold, one in each sale. Yet wings are listed here four times and the Qty, if totaled, would be five. Keep in mind this report is not about the total quantity and revenue sold, and therefor totals are not included in this report as they would not make any sense; it is to figure out what products sell with others. Also note, the sale, which is the first sale or second sale in this case, doesn’t matter much but it helps the explanation.
Example Explanation
-
The first line item says: One order of chicken wings sold at $9.95 in the first sale with four bottles of Corona at $25.60 which also happened to be in the first sale.
-
The second line item says: Two orders of chicken wings sold at $19.90, that is two orders sold, one in each sale, with two bottles of Gatorade at $6.50, also one in each sale.
-
The third line item says: One order of chicken wings sold at $9.95 in the second sale with two double vodkas at $22.60 which is also in the second sale.
-
The fourth line item says: One order of chicken wings sold at $9.95 in the first sale with two sweet teas sold at $3.80 which is also in the first sale.
So, the Corona in this case is the highest trending product with wings over the past 30 days. The other three line items show all other products that sold along with wings and the respective Qty and Revenue from each association.
Now let’s remove the filter to see all the products from those two initial sales and you will see that each product can be both the Primary and Secondary product, but not at the same time in each line item.
The report is sorted by primary item and then secondary quantity in descending order so that for each primary product, the most popular secondary product is listed at the top.
FILTERS
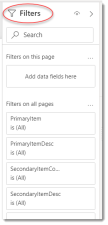
There are various filters on the right-hand sidebar that you can use to narrow down the data.
Note these are the page filters, if you select the visual, meaning to click the report, you will see additional filter options.
Tips
- Filters which are the gold back color controls on the report allow you to pick from a list. Hold down the Ctrl key on the keyboard to select multiple items.
- If you want to search for a particular value, use the filters in the right pane menu. They will have a search box in addition to a list of the items.
- Use the Advanced option in the right menu panel for advanced search options.
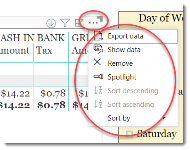
- Use the three dots […] in the top right of a visual for more options like Export data.
- Use the Help button to open the user guide for any given report
 .
.
