Qty Matrix – Customer/Store
This is a Club Prophet Executive Report v4 – Power BI or PBI.
Note: Samples are using demo data and do not reflect real-world data.
Qty Matrix – Customer/Store
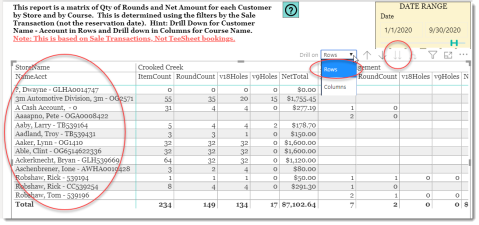
This report, designed for multi-site managers, shows where golfers are playing on which of the multi-site courses. The matrix shows how many rounds each golfer played by Store and further by Course. We also show the number of items purchased on the sale when the golfer checked-in and the total net (without tax) of the sale. This assumes that all of the multi-site courses are running from a single central database.
The report lists the Customer Last Name, First Name followed by Account Number.
Fields on the report include:
-
Columns:
-
StoreName – The Name of the Store where the transaction occurred.
-
CourseName – The Name of the Course that the golfer played.
-
-
Rows:
-
AcctName – the Account Number and Name of the Customer (Acct – Name).
-
NameAcct – the Name of the Customer and Account Number (Name – Acct).
-
-
-
Values:
-
ItemCount – The number of Items (Qty) sold on the Sale where the green fee was sold when the golfer Checked-In.
-
RoundCount – The number of Items (Qty) of Green Fees sold in the given transaction when the Golfer Checked-In.
-
v18Holes – the number of 18 Hole rounds sold in the given transaction when the golfer Checked-In.
-
v9Holes – the number of 9 Hole rounds sold in the given transaction when the golfer Checked-In.
-
NetTotal – the Net Total Amount (does not include tax) of the given Sale where the golfer Checked-In.
-
Navigation
The default view of this report shows
-
Rows listed by Account# - Customer LastName, FirstName
-
Columns grouped by Store Name
You can switch the rows to show Customer LastName, FirstName – Acct by selecting Rows and drill down using the Double Down Arrow icon:
Use the Single Up Arrow to drill back up.
To see the columns grouped by course name you can use either the Double Down Arrow icon or the PitchFork. They provide slightly different views. The Double Down Arrow will replace stores and group by course name. The PitchFork control will retain the store name and show each course under the given store. Here is what the drill down on Columns using the PitchFork control looks like:
Note the first group of columns has a blank course name. This is typically due to selling green fees directly from the Sale screen instead of Check-In from the tee sheet. You can use the Filters to omit these records if you like. The better thing to do is to always check-in from the tee sheet for more accurate reporting.
Filters:
Tips
- Filters which are the gold back color controls on the report allow you to pick from a list. Hold down the Ctrl key on the keyboard to select multiple items.
- If you want to search for a particular value, use the filters in the right pane menu. They will have a search box in addition to a list of the items.
- Use the Advanced option in the right menu panel for advanced search options.
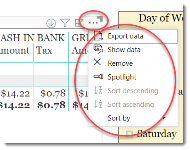
- Use the three dots […] in the top right of a visual for more options like Export data.
- Use the Help button to open the user guide for any given report
 .
.


