Revenue per Product xref Package
This is a Club Prophet Executive Report v4 – Power BI or PBI.
Note: Samples are using demo data and do not reflect real-world data.
Revenue per Product xRef Package
This report is handy to see where individual products are sold across various Packages
Fields on the report include:
-
· Columns:
-
o PackageCode – The Package Code where the product was sold as part of the given Package. Note that a blank Package (first column) shows where a product was sold individually and not as part of a Package.
-
o Year – Shows the report by Year.
-
o MMYYYY – Shows the report by Month and Year (MMYYYY format).
-
o Date – Shows the report by Date (mm/dd/yyyy format).
-
-
· Rows:
-
o ItemDescCode – the Item Description followed by the Item Code (Description – Code).
-
-
· Values:
-
o Qty – The number of Product sold (individually or as part of a given package).
-
o ExtPrice – the Extended Price for the given Product as it was sold (Individually or as part of a Package).
-
o Tax – the Amount of Tax collected in the sale for the given Product.
-
-
This is a Matrix style report where you can use these controls:
In the top Right of the visual to navigate thru various levels. This report has only one row so you don’t see the typical Rows and Columns options. The Drill Up and Down will move thru the column selections listed above. Use the Single Arrow icon to scroll up and there are two choices to drill down.
-
· The Double Down arrow will take you from Packages to Years (then MMYYYY and finally Date) for the given Product row.
-
· The Down pointing PitchFork icon will maintain the Package and show the values by Year (then MMYYYY and Date).
Row Totals – To the far Right there are Total Values for the given row. So, you can see the total units sold and price for a given product from all the packages as well as individually sold.
FILTERS – There are various filters you can use to narrow down the data. Filters are the gold background controls as well as the Filters right hand sidebar. So in addition to the Date Range you can also filter to a particular Store.
If you click the visual, you get more filter options:
This can come in handy if you want to filter on a specific Product Code or Description.
For example:
Here we want to find where a specific product was sold over the past few months. The product code is ‘1060’.
We did a few things:
-
· The Date Range spans several months.
-
· Using the ItemCode filter on the right, we clicked the dropdown, switched to advanced, entered ‘1060’ and clicked Apply Filter.
-
· Then we clicked the down PitchFork control twice to move down the MMYYYY view.
Now you can see that this product was only sold in this one package because there is only one listed, and the Qyt, Amount, and Tax for each month is split out. Totals for each grouping are included on the right as well as column totals across the bottom.
Tips
- Filters which are the gold back color controls on the report allow you to pick from a list. Hold down the Ctrl key on the keyboard to select multiple items.
- If you want to search for a particular value, use the filters in the right pane menu. They will have a search box in addition to a list of the items.
- Use the Advanced option in the right menu panel for advanced search options.
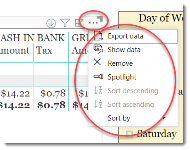
- Use the three dots […] in the top right of a visual for more options like Export data.
- Use the Help button to open the user guide for any given report
 .
.


