Revenue
This is a Club Prophet Executive Report v4 – Power BI or PBI
Note: Samples are using demo data and do not reflect real world data.
Revenue
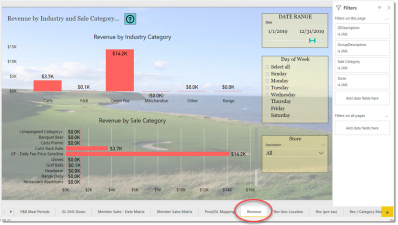
The Revenue report shows two graphical representations. The upper half of the screen shows Revenue by Industry Category (Green Fee, Cart Fee, Merchandise, etc) in a vertical bar chart. You can also drill down on this particular bar chart from Industry code to Sale Category to Product code.
The bottom half of the screen has a horizontal bar chart by Sale Category that again shows revenue broken down by Sale Category.
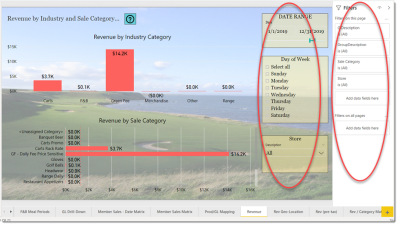
Both reports use the Filters on the right to show data for the selected date range. You can further filter by days of the week (for example select Saturday only to just see what you did on Saturdays during the date range. You can also select the data for one or more Stores if you have multiple stores in your database.
Graphs tend to generalize data. In this example $14.2K for green fees. If you want to see the actual amount there are two ways to do so. The first way, if you are interested in just one data point, is to hover your mouse over the data point.
This will open a window showing you the exact value:
If you want to see all the data points, you can do the following:
- Select the visual by clicking it.
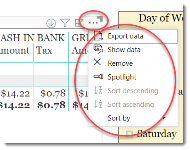
- Select the […] in the top right of the visual.
- Select […] and select Show Data.
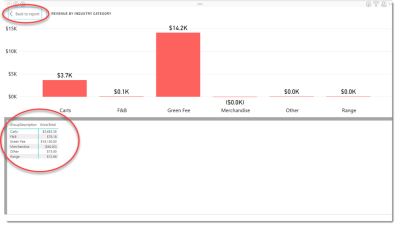
The following displays:
The raw data is displayed in the lower half of the screen.
To get back to the report, select the Back to report button in the top left.
Alternatively, you can select Export data and export that table of data to Excel.
FILTERS
There are various filters you can use to narrow down the data. Filters are the gold background controls as well as the Filters right hand sidebar.
Tips
- Filters which are the gold back color controls on the report allow you to pick from a list. Hold down the Ctrl key on the keyboard to select multiple items.
- If you want to search for a particular value, use the filters in the right pane menu. They will have a search box in addition to a list of the items.
- Use the Advanced option in the right menu panel for advanced search options.
- Use the three dots […] in the top right of a visual for more options like Export data.
- Use the Help button to open the user guide for any given report
 .
.


